
Visitor surveys at events and festivals typically focus on out-of-town attendance: how many tourists came, where they travelled from, how much they spent. This makes sense when the goal is demonstrating tourism impact to funders and sponsors. But local residents make up a significant and often majority share of attendance at most community events, and their experience tells a different and equally important story.
Local attendees can compare this year to previous years, know whether the event has become more or less relevant to the community over time, and can speak to whether it strengthens local culture and participation in ways that no tourist ever could. Their feedback is the measure of whether the event is delivering for the people it was created to serve.
This guide explains how to build the local visitor section of a community event feedback survey using Clappia, a no-code platform that lets you build mobile forms and collect structured data in the field without any coding. If you are new to Clappia: you build a form by adding blocks, which are individual field types like a multiple choice question, a text input, or a number field. Each completed form entry is stored as a submission, and you can view, filter, and analyse all submissions in Clappia's dashboard. The steps below cover which fields to add and how to configure them so the right questions reach the right visitors.
A single undifferentiated survey asks every visitor the same questions regardless of whether they live locally or travelled from far away. This produces two problems: irrelevant questions for some visitors (asking a local resident about accommodation spend when they live nearby), and missing questions for others (never asking tourists whether the event has improved local cultural identity, because they have no basis to judge).
The solution is a branching question that routes local and tourist visitors to their respective question sets. In Clappia, this is done with a field labelled Where are you from? with two options: Local and Non-local (Tourist). Each follow-up field is then given a Display Condition, which is a rule in Clappia that controls when a field appears. Fields in the local branch are set to show only when Where are you from? equals Local, and the tourist fields are set to show only when it equals Non-local (Tourist). Each visitor sees only the questions relevant to them, and the form feels appropriately short for either path.
Open your survey app in Clappia's form builder and locate the section where visitor-specific questions sit. All fields described below should have a Display Condition set to show only when Where are you from? equals Local. To set a Display Condition on a field, open the field's settings in the builder and add the condition rule there.
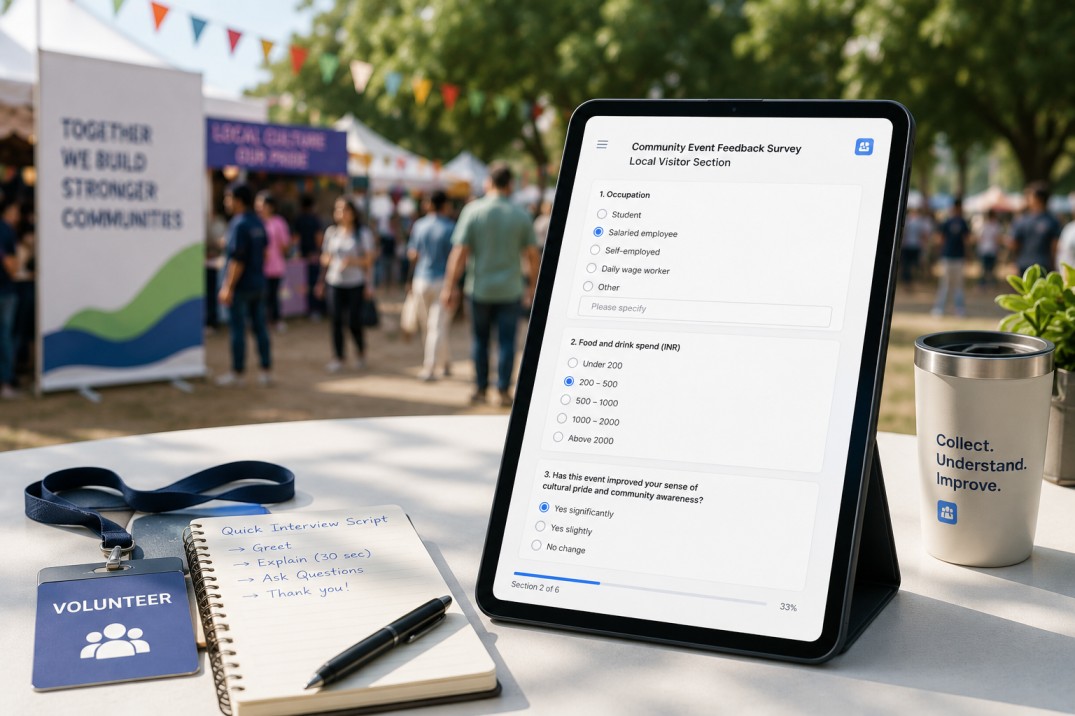
Add a Radio Button block labelled Occupation. A Radio Button block presents a list of options where the visitor taps to select one. Add options covering the main categories relevant to your community: student, salaried employee, self-employed, daily wage worker, and other. Then add a Single Line Text block labelled Other occupation (please specify) and set its Display Condition to show only when Occupation = Other. This way a free-text input only appears when someone selects Other, keeping the form clean for everyone else.
Occupation data from local visitors tells organisers which community demographics are actually attending. A festival drawing primarily students and daily wage workers is serving a different segment of the local population than one drawing salaried professionals. This affects programming decisions, stall pricing, timing of activities, and what kinds of improvements matter most to the audience that shows up.
Add two Radio Button blocks using spend bands (ranges like under 200, 200 to 500, 500 to 1000, and so on in your local currency) for:
Local visitors do not have accommodation spend since they live nearby, so only these two categories are needed for the local path. Using spend bands rather than asking for an exact figure makes visitors more willing to answer and produces data that is easier to aggregate. Across the full local visitor sample, these figures produce an estimate of the event's direct economic contribution from resident attendance, which is useful for local government and business association stakeholders who care about the event's impact on local traders.
Community Impact: The Questions Only Local Visitors Can Answer
Add two Radio Button blocks with three response options (Yes significantly, Yes slightly, No change) for:
These two questions have no equivalent in the tourist path. They measure something spending data and attendance figures cannot: whether the event is fulfilling its role as a community institution in the eyes of the people who live there. An event that draws large local crowds but where most residents perceive no improvement in cultural awareness or community participation is telling a very different story than one where the majority say it has made a significant positive difference.
Community impact questions answered by local residents are the closest proxy available for measuring whether an event is actually serving its host community. They belong in every local government or community development evaluation of a recurring event.
One of the most useful data points for planning the next edition of an event is how it compares to previous years in the view of people who have attended before. First-time visitors can tell you whether they enjoyed themselves, but they have nothing to compare it to. Returning visitors can tell you whether things are getting better or worse.
Capture this with a conditional field near the start of the survey. Add a Yes/No block labelled Is this your first visit?. Then add a Radio Button block labelled How does this year compare to previous years? with options: Better organised, About the same, and Less well organised. In Clappia's block settings, set this second field to be editable only when Is this your first visit? = No. This is an editability condition: the field is visible to all respondents but locked (greyed out and unselectable) for first-time visitors. Returning visitors can interact with it; first-timers cannot. The enumerator does not need to skip the question manually; the form handles it.
Filtering this question's responses to local returning visitors specifically produces a community-insider view of event quality over time. Local residents who attend every year are the most qualified judges of whether the event is improving as a community institution, and their signal is more meaningful for planning purposes than the opinions of visitors who only experience it once.
Add a Radio Button block labelled How did you hear about this event? with options: newspaper or print, word of mouth, radio, social media, television, official website, and other. Add a Single Line Text block for the Other text that appears only when Other is selected. This question sits after the origin branch and appears for all visitor types with the same options.
For the community feedback analysis, filtering this question to local respondents only tells you which channels are reaching the resident population specifically. If most locals heard through word of mouth rather than paid advertising, that reflects strong community embeddedness but potentially weak formal marketing reach. If a significant proportion heard through social media, that shows which platforms are effectively reaching the local demographic and can inform where to concentrate promotion for the next edition.
The satisfaction and suggestions section appears for all visitor types. When filtered to local respondents specifically, it often reveals a different picture than the overall satisfaction data, because locals bring more context and a longer history with the event than first-time tourists.
Add five Radio Button blocks with options Dissatisfied, Moderate, and Satisfied for each of the following areas:
Local visitors tend to rate amenities more critically than tourists because they have a year-on-year comparison. Cultural performances tend to be rated with more nuance by locals because they have context for what is traditional and authentic versus what has changed. Separating satisfaction scores by visitor type in Clappia's Analytics feature, which lets you build dashboards and filter charts directly on the submission data without exporting anything, reveals whether the community experience differs from the tourist experience in ways that need different responses.
Add a Multi-Select block labelled What would you suggest improving?. Unlike a Radio Button block where visitors choose one option, a Multi-Select block lets them choose as many as apply. Add the following options:
Add a Single Line Text block for the Other text that appears only when Other is selected. When you view the local visitor suggestion data in Clappia's Analytics, the count of selections per category tells you directly which improvement areas residents most frequently raised. If facilities and infrastructure are selected by a large proportion of local respondents while cultural programming is rarely chosen, the budget priority for next year is clear without any manual analysis.
Add a Radio Button block labelled Would you attend this event again next year? with options: Yes, No, and Maybe. For local visitors, a high Yes rate reflects strong community ownership of the event. A high Maybe rate, particularly when cross-referenced with low satisfaction on specific areas, indicates conditional loyalty that can be converted with targeted improvements. A high No rate among locals is a warning signal that warrants investigation into the satisfaction and suggestion data to understand what is driving it.
Clappia's Analytics feature lets you build dashboards directly on the submission data. You do not need to export to a spreadsheet. Each chart or metric you configure filters and counts the relevant submissions automatically. For the local visitor branch, the most useful views to build are:
| Analysis | How to Configure It | What It Tells You |
|---|---|---|
| Community impact scores | Count of each response for the cultural awareness and community participation questions, filtered to Local visitors | The proportion of locals who perceive significant, slight, or no community benefit from the event |
| Year-on-year comparison | Count of each response for the year comparison question, filtered to Local visitors where Is this your first visit? = No | Whether the event is perceived as improving, stable, or declining among returning local residents |
| Satisfaction by visitor type | Average satisfaction score per category, comparing Local vs Non-local filters | Whether local and tourist satisfaction patterns differ and where the gaps are largest |
| Improvement priority ranking | Count of selections for each suggestion category, filtered to Local visitors, sorted by frequency | Which areas local residents most want improved; a direct input for planning priorities |
| Occupation breakdown | Count of each occupation option among local visitors | The demographic composition of the local audience |
| Local spending contribution | Average of each spend band, multiplied by estimated local visitor count | An estimate of the event's economic contribution from resident attendance |
| Return intent by satisfaction | Cross-tabulation of Would you attend again? against Overall experience, filtered to Local visitors | Whether satisfaction levels predict return intent among the local community |
In Clappia, user permissions are set per app. Enumerators running the survey on the ground should be given Submit Only access: they can fill in and submit forms and view their own past submissions, but cannot see submissions from other team members or change any form settings. The survey coordinator who reviews and analyses the data needs Full Access to configure the analytics dashboards and filter across all submissions.
The Clappia mobile app, available on Android and iOS, presents the survey in the same layout as the form builder but optimised for a phone screen. The Display Conditions that route local and tourist visitors to their respective question sets evaluate on the device itself, so they respond instantly without needing a server connection. Clappia supports offline mode: the form can be filled in and submitted without network connectivity, and submissions sync automatically when the device reconnects. For events in areas with unreliable mobile data, ask enumerators to open the Clappia app on Wi-Fi before the session so the form is cached on the device and ready to use offline.
The local visitor branch of a community event survey captures data that no attendance figure or tourism report can provide: how residents perceive the event's cultural impact, whether they believe it strengthens community participation, how it compares to previous editions in their view, and which specific improvements they most want to see. This is the dataset that tells organisers whether the event is working for the people it was created to serve.
Building this branch in Clappia involves a branching origin question, a handful of structured local-specific fields, a conditional year-on-year comparison field enabled only for returning visitors, and a multi-select improvement suggestion field that produces a ranked priority list directly from resident feedback. The Display Conditions that make the branching work are configured in the field settings without any coding.
To build this survey, create a new app in Clappia and add the fields described above. Each field is added as a block in Clappia's visual form builder, and the Display Conditions are set within each block's settings.
L374, 1st Floor, 5th Main Rd, Sector 6, HSR Layout, Bengaluru, Karnataka 560102, India
3500 S DuPont Hwy, Dover,
Kent 19901, Delaware, USA


.svg)




3500 S DuPont Hwy, Dover,
Kent 19901, Delaware, USA
L374, 1st Floor, 5th Main Rd, Sector 6, HSR Layout, Bengaluru, Karnataka 560102, India



%20(1).jpg)
.avif)