
Still need help?

A Gantt chart gives you a timeline view of the tasks in your app. Instead of viewing each task as a separate submission, you can see when each task starts, when it is expected to finish, how long it will take, how much of it has been completed, which team or resource it belongs to, and whether it depends on another task.
This is useful when you are managing a project with several tasks that need to be completed over a period of time. For example, a manufacturing project may have tasks such as preparing drawings, procuring raw materials, fabricating a machine frame, assembling the machine, and testing it. Once these tasks are submitted in Clappia, you can use their information to display the project as a Gantt chart.
The Gantt chart uses fields from your app to understand what each submission represents. You select a field that identifies the task, another field that contains the task name, fields for the planned start and end dates, a field for the person or team responsible for the task, and a field for tracking completion. You can also map a field for dependencies so that the chart shows which task needs to come before another task.
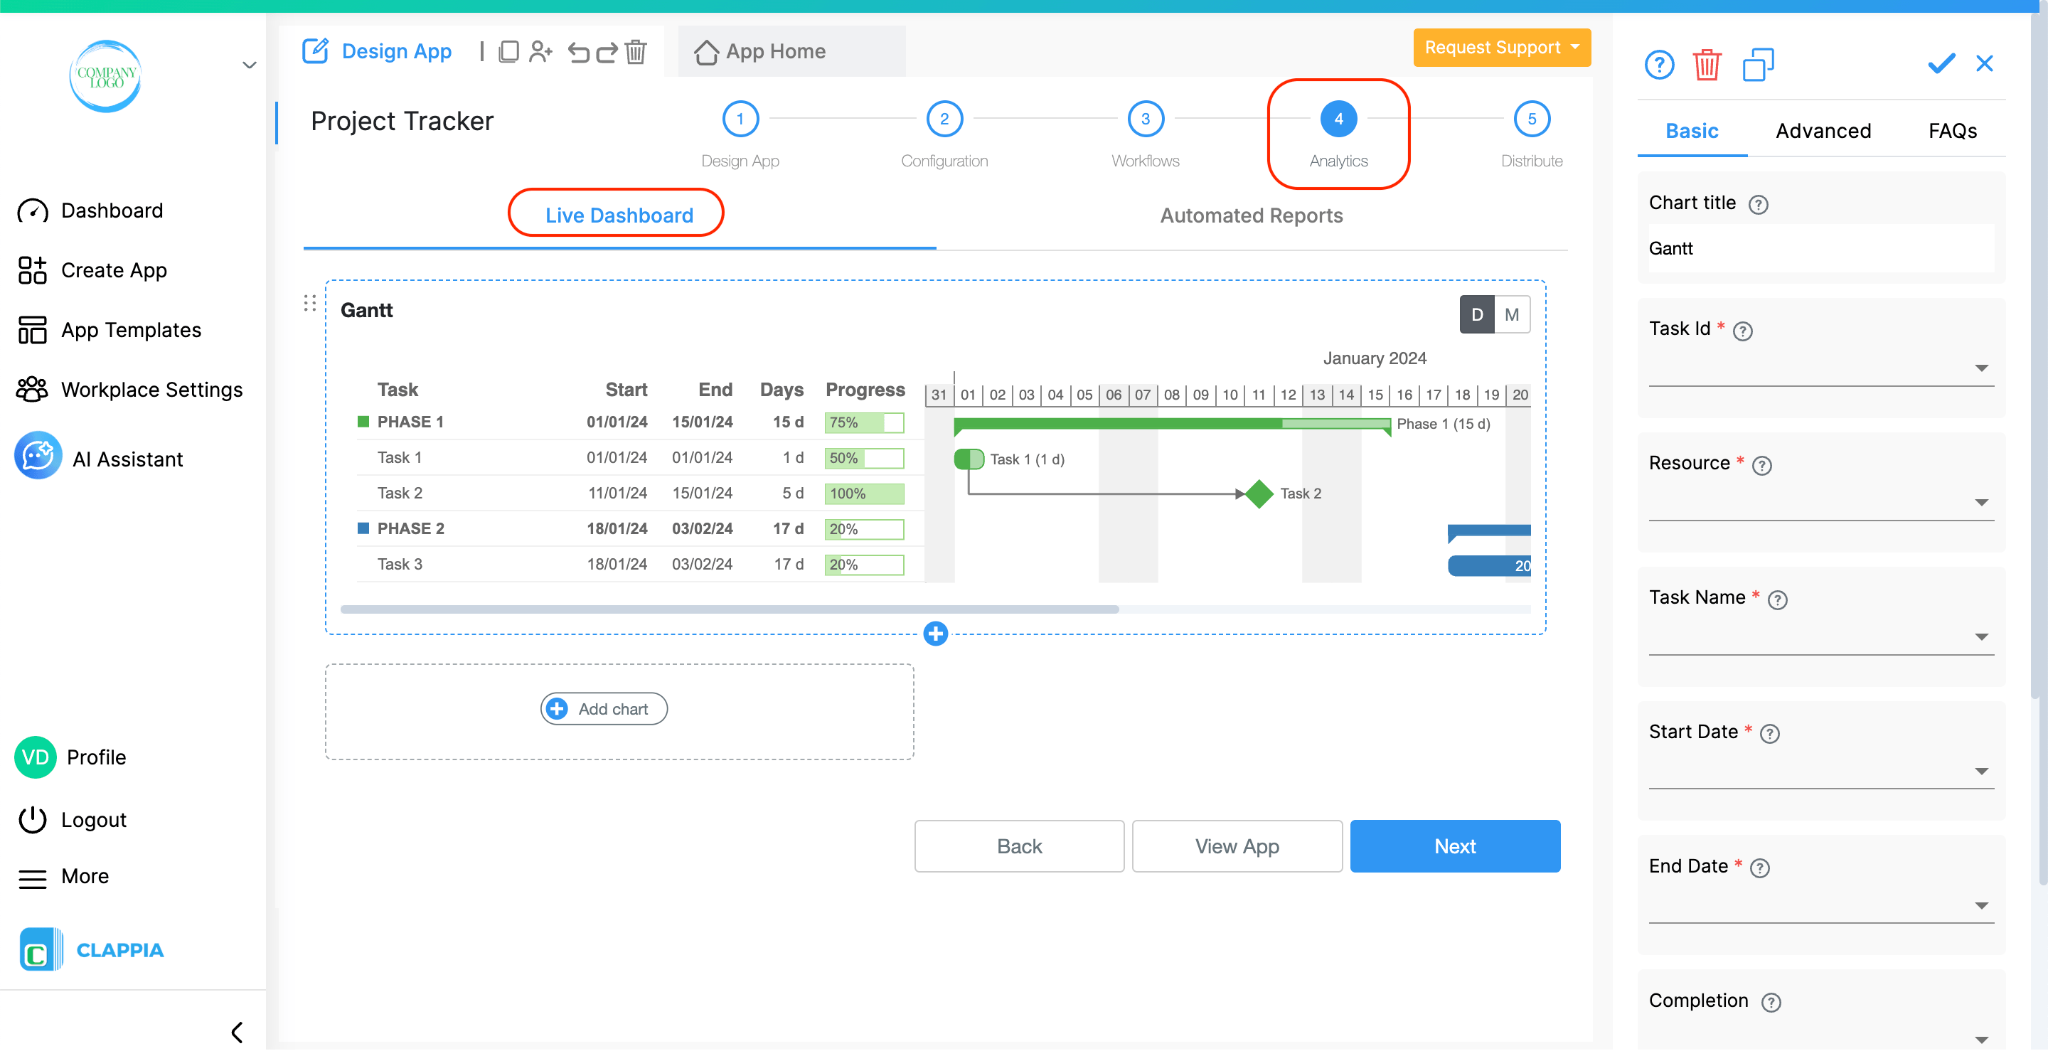
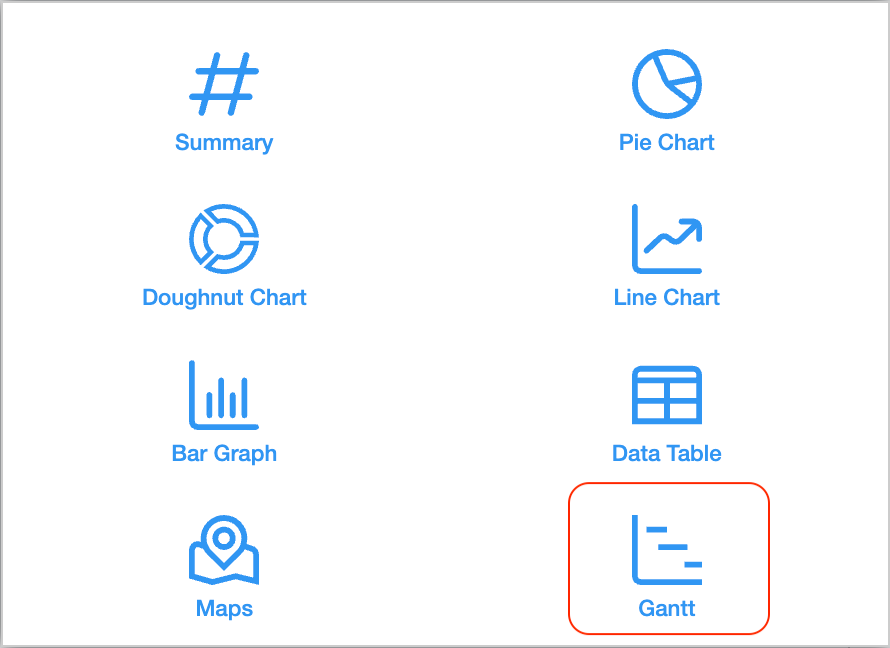
To create a Gantt chart, go to Design App > Analytics > Live Dashboard and click Add chart. Select Gantt from the available chart types.
Once the Gantt chart is added, you can configure it from the panel on the right. Start by entering a Chart Title so that you can identify the chart on your dashboard.
You will then need to map the fields from your app to the corresponding Gantt chart options.
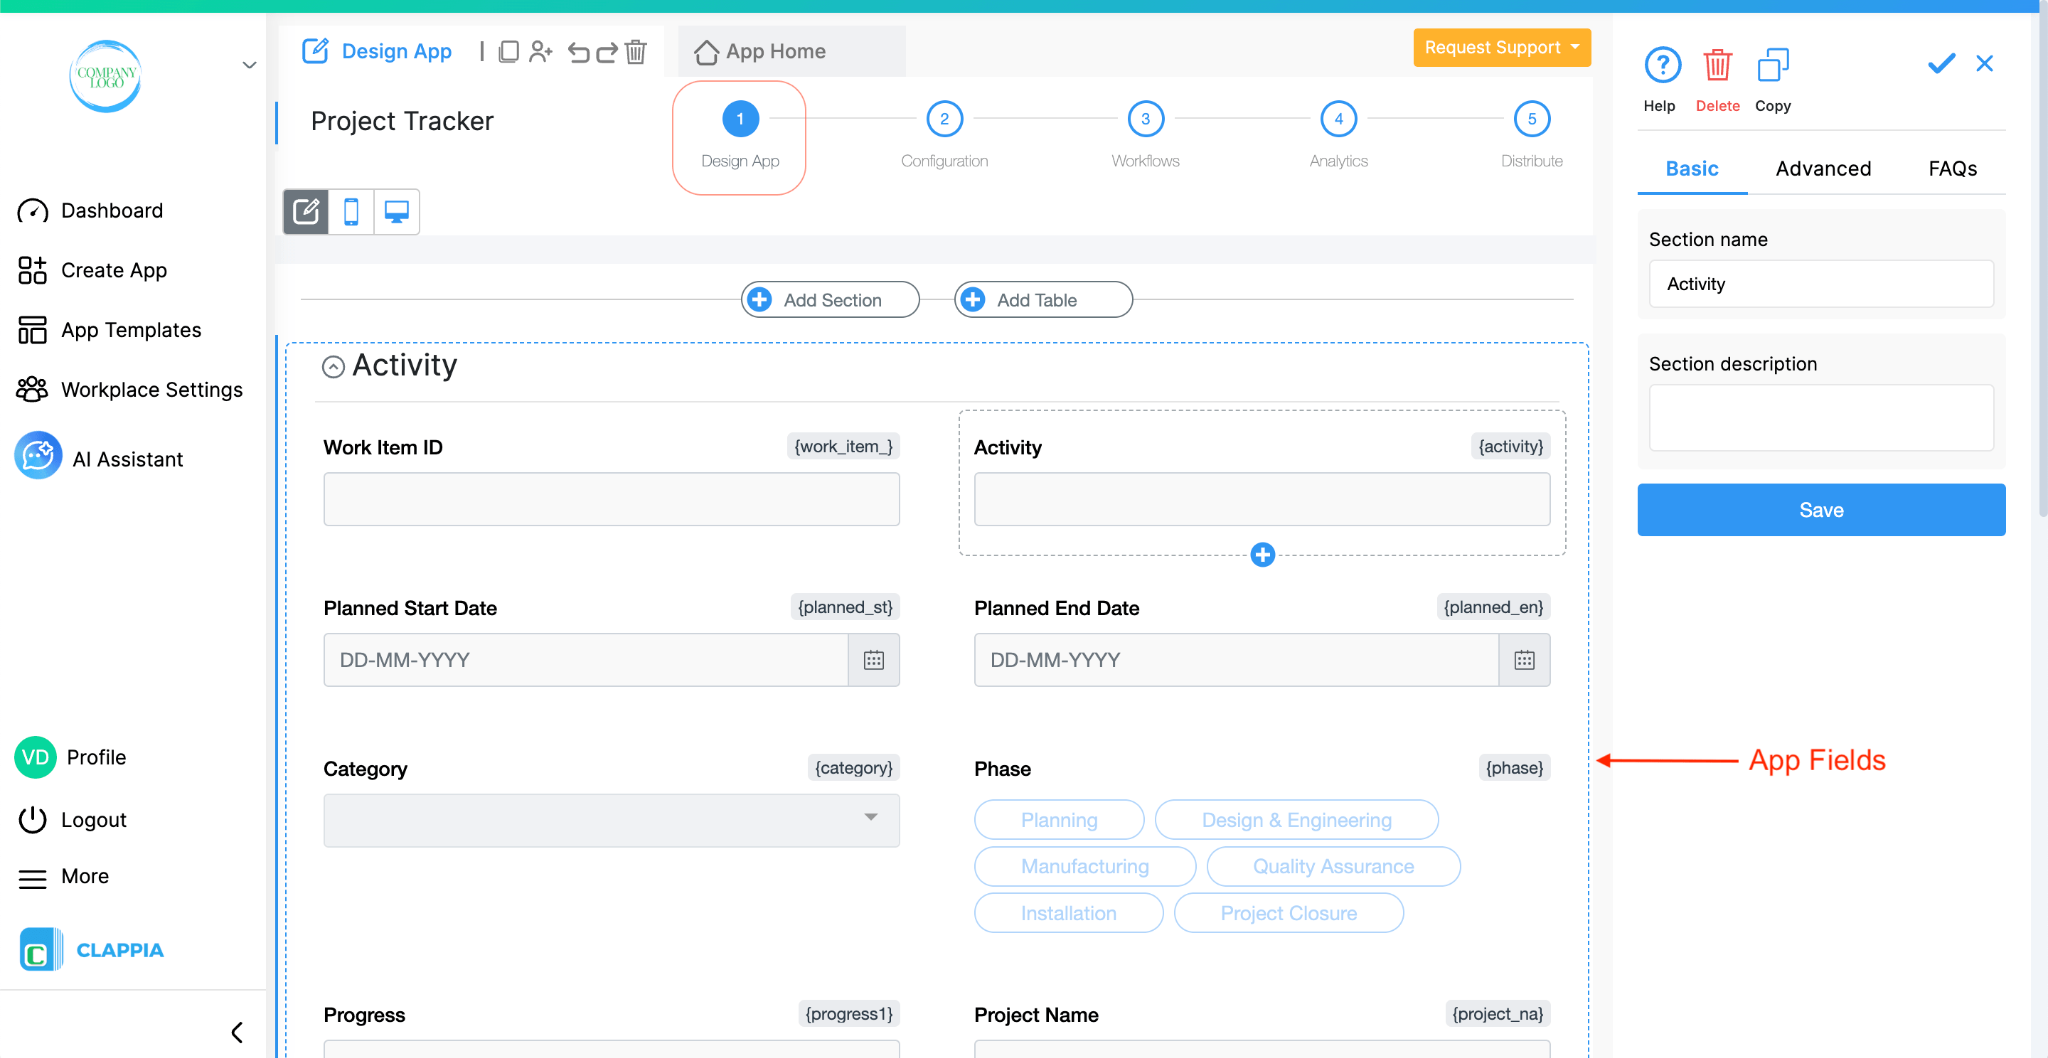
Task Id identifies each task on the Gantt chart. Select a field from your app that contains a unique ID for every task.
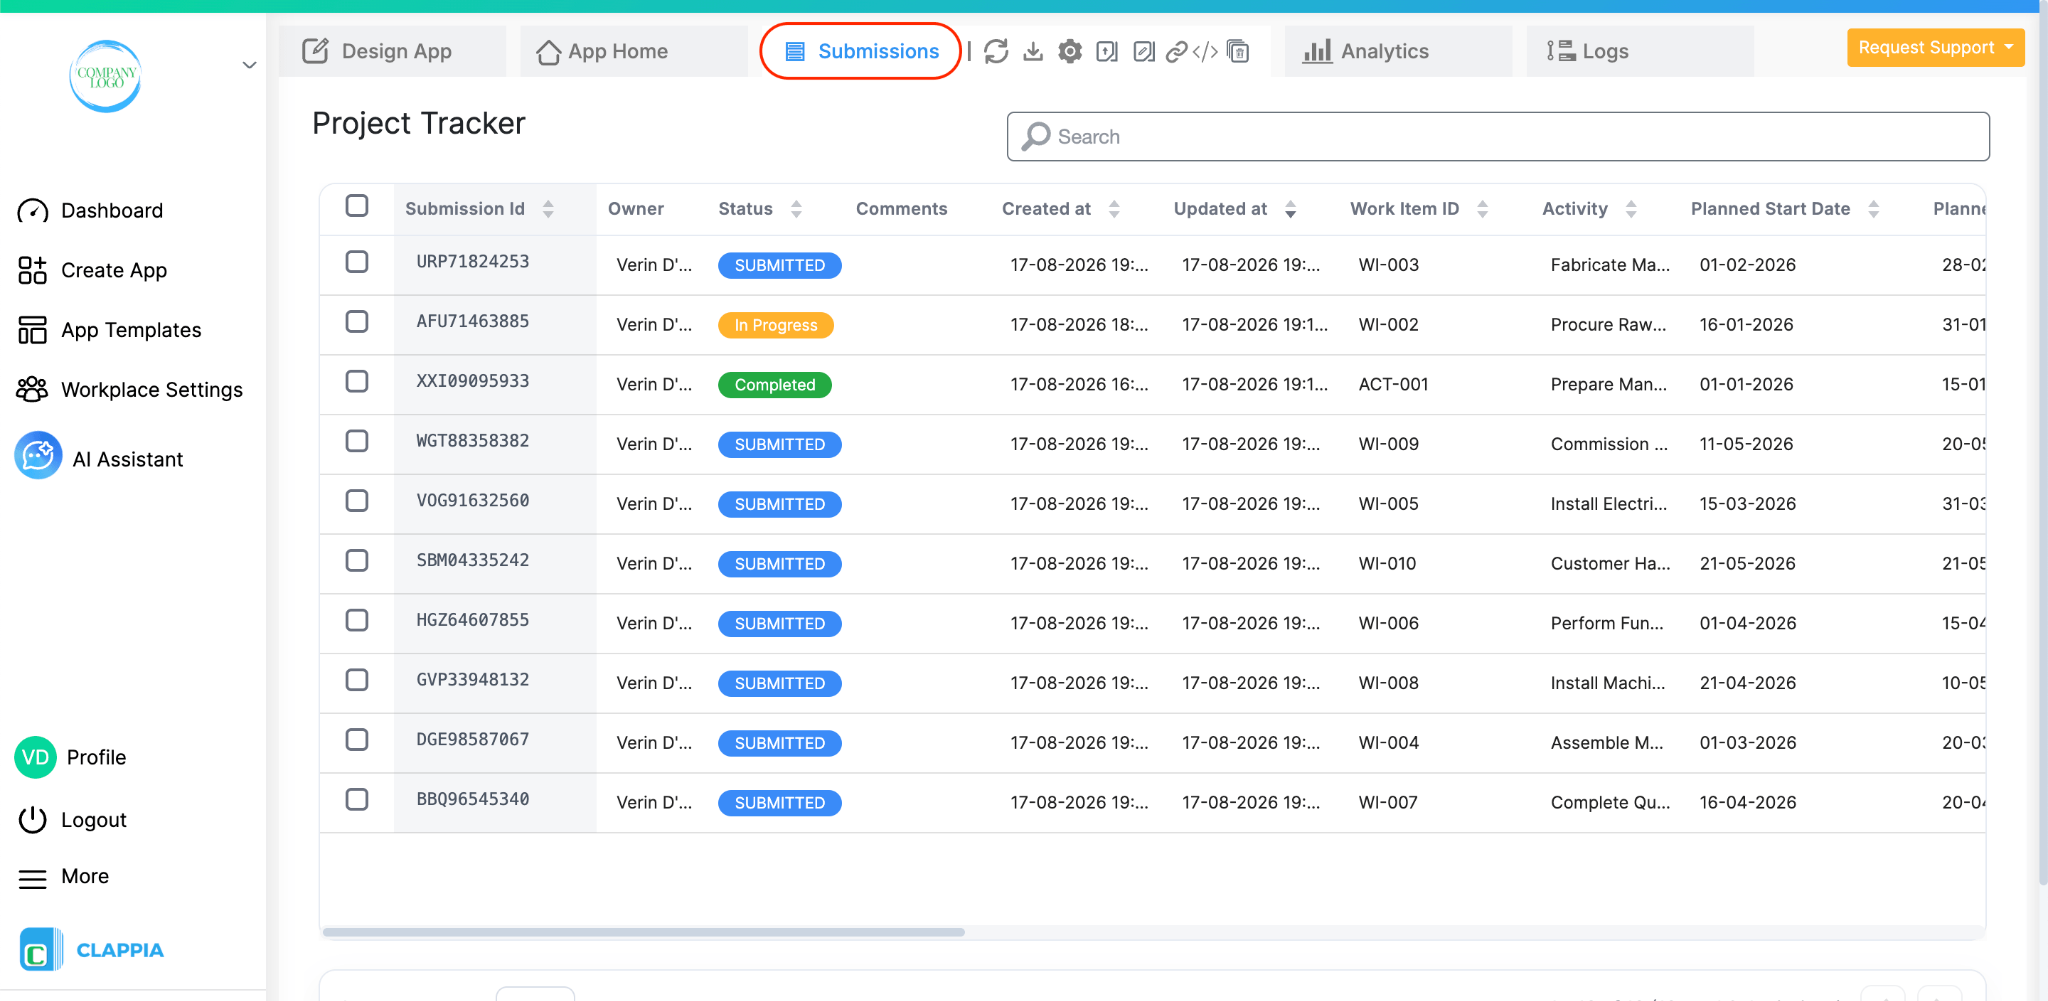
For example, suppose your app has a field called Work Item ID and you give every task a different ID such as WI-001, WI-002, and WI-003. Select Work Item ID for Task Id.
These IDs are important when you want to create dependencies between tasks because the dependency field uses the Task ID to identify the task that comes before another task.
Resource is used to group tasks that belong to the same person, team, department, or other resource that you want to track on the Gantt chart.
For example, suppose your app has a field called Team and you use values such as Design Team, Procurement Team, Fabrication Team, and Testing Team. Select Team as the Resource field.
If you have several tasks assigned to the Procurement Team, those tasks are shown together under that team on the Gantt chart. This makes it easier to see which tasks belong to each team and how their work is spread across the project timeline.
Task Name is the name of the task that you want to see on the Gantt chart.
For example, suppose your app has a field called Activity where you enter the work that needs to be completed. You may have submissions with activities such as Prepare Manufacturing Drawings, Procure Raw Materials, and Fabricate Machine Frame.
Select Activity as the Task Name field. The activity entered in each submission will then be displayed as the task name on the Gantt chart.
Start Date tells the Gantt chart when each task is planned to begin.
For example, suppose your app has a field called Planned Start Date. When you enter 10 August as the planned start date for a task, the task begins at that point on the Gantt chart timeline.
Select your app's planned start date field for Start Date.
End Date tells the Gantt chart when each task is planned to finish.
For example, suppose you have entered 15 August as the planned end date for a task. The Gantt chart will show the task from its Start Date through 15 August.
Select your app's planned end date field for End Date.
The Start Date and End Date together determine how long the task is displayed on the timeline.
Completion shows how much of a task has been completed.
For example, suppose you have a Progress field in your app where you enter the completion percentage for each task. If a task is just starting, you can enter 0. If half of the work is complete, you can enter 50, and when the task is finished, you can enter 100.
Select this field for Completion. The Gantt chart uses the value to show the progress of each task.
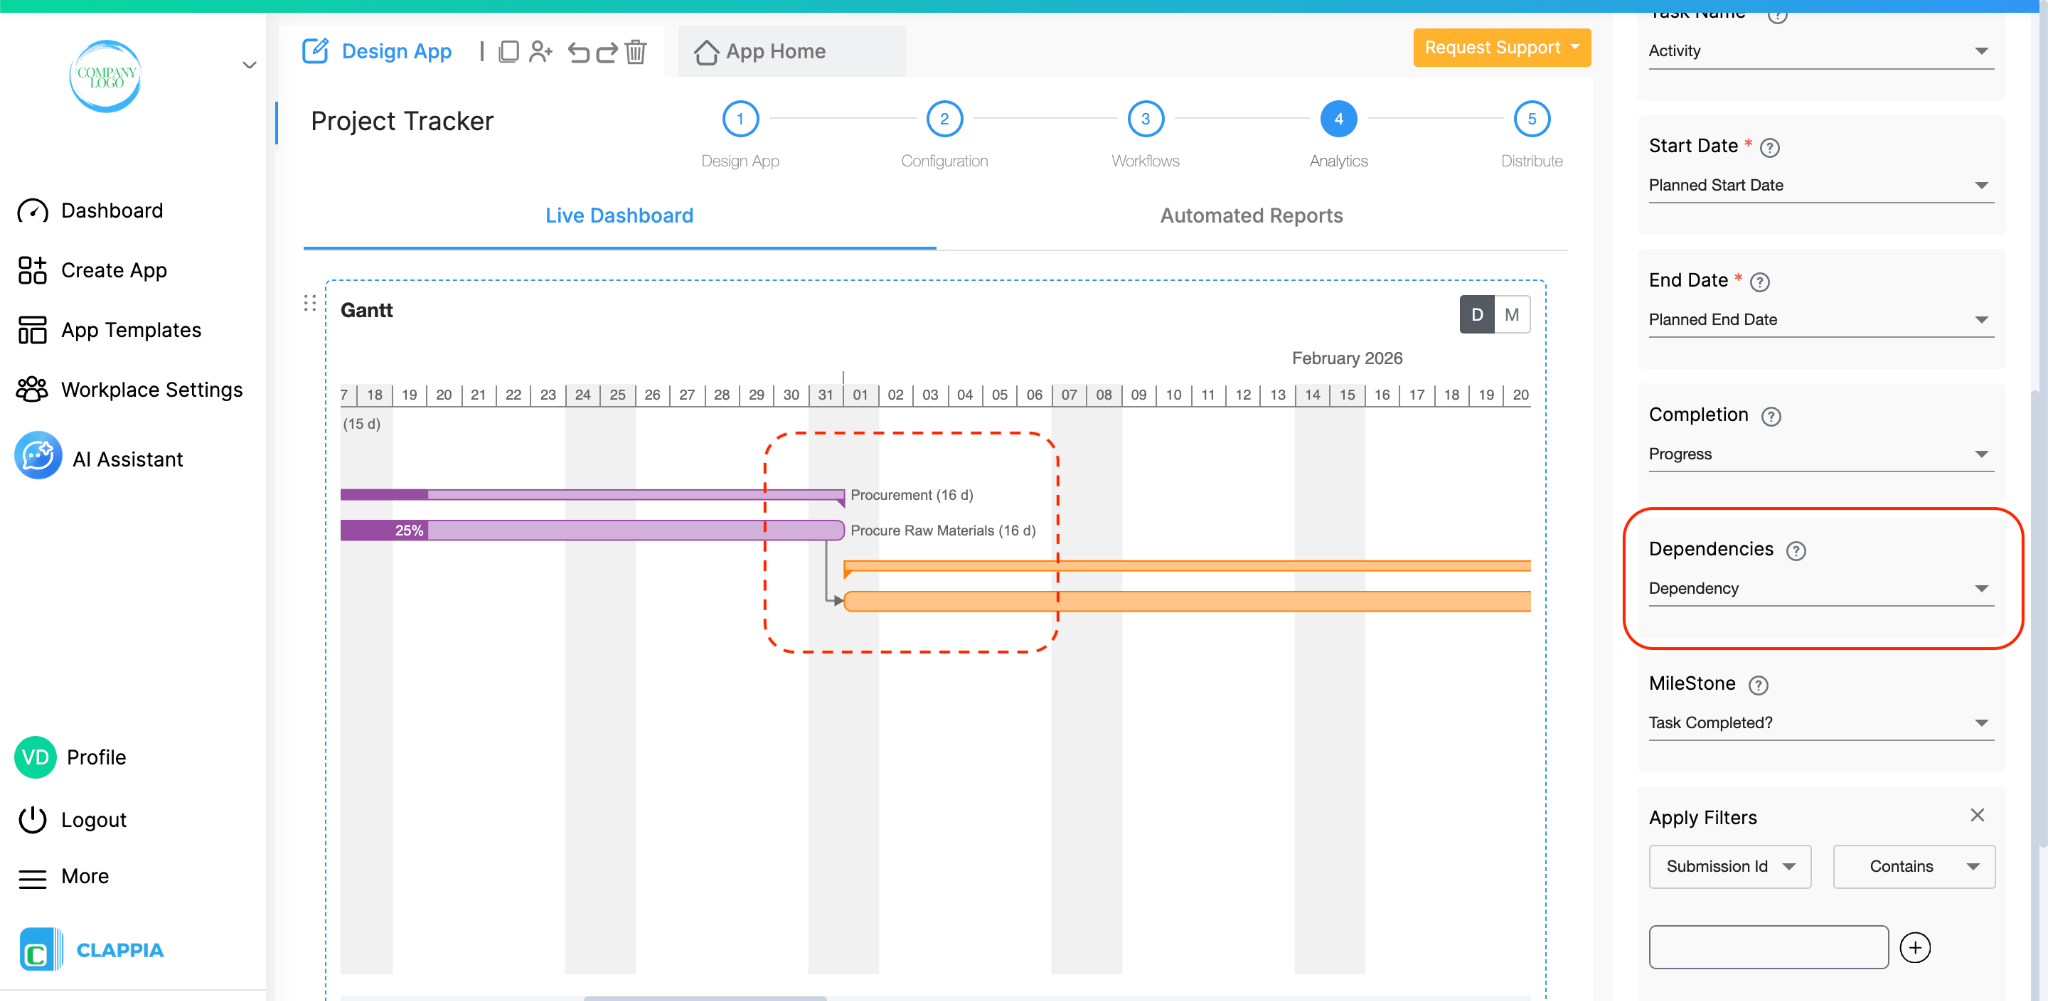
Dependencies lets you show that one task needs to be completed before another task can begin.
This is useful when the tasks in your project have to happen in a particular order. For example, suppose your project has a Procure Raw Materials task followed by a Fabricate Machine Frame task. The fabrication work cannot start until the raw materials have been procured.
To show this relationship, create a field in your app to store the Task ID of the task that must come first. For the Fabricate Machine Frame submission, enter the Task ID of Procure Raw Materials in this field.
For example, if Procure Raw Materials has the Task ID WI-002, enter WI-002 in the dependency field of Fabricate Machine Frame. Then map this field to Dependencies in the Gantt chart configuration.
The Gantt chart will use the Task ID to identify the previous task and display a connector between the two tasks, making the dependency visible on the chart.
You can use the same approach whenever one task needs to follow another task. The value entered in the dependency field should match the Task ID of the task that it depends on.
MileStone is used to identify a milestone in your project. A milestone represents an important point in the project rather than a task that takes a period of time.
For example, you may have an important point such as Design Approved, Production Started, or Final Inspection Completed that you want to identify separately on the project timeline.
Select the field from your app that you want to use for identifying these milestone submissions and map it to MileStone.
The field used for this purpose should provide a value that indicates whether the submission is intended to be treated as a milestone.
Apply Filters lets you control which submissions are displayed in the Gantt chart.
For example, suppose your app contains tasks for several projects and you have a Project field that identifies which project each task belongs to. You can add a filter so that the Gantt chart displays only the submissions belonging to the project you want to view.
Select the field you want to filter by, choose the required condition, and enter the value to be used for the filter. You can add more than one filter when you need to narrow down the submissions further.
L374, 1st Floor, 5th Main Rd, Sector 6, HSR Layout, Bengaluru, Karnataka 560102, India
3500 S DuPont Hwy, Dover,
Kent 19901, Delaware, USA


.svg)



3500 S DuPont Hwy, Dover,
Kent 19901, Delaware, USA
L374, 1st Floor, 5th Main Rd, Sector 6, HSR Layout, Bengaluru, Karnataka 560102, India