
Local festivals and fairs draw visitors from well beyond the immediate area, but most event organisers have only a rough sense of how many of those visitors are tourists, where they travelled from, how long they stayed, and how much they spent. This information matters for every stakeholder involved: tourism boards that fund events need evidence of visitor impact, local businesses want to understand how much spending the event generates, and organisers need data to make the case for continued investment.
Collecting this data during the event is the only reliable way to get it. Post-event surveys suffer from low response rates and recall bias; administrative data like hotel bookings captures only a fraction of actual visitors. A mobile survey administered on-site, where enumerators approach visitors and fill in a structured form on a phone or tablet, produces a representative sample with high completion rates and accurate recall.
This article explains how to build the tourist-specific branch of a visitor survey in Clappia, a no-code platform for field data collection, and how to use the data it produces to calculate the tourism impact KPIs that funding bodies and planners actually need.
A visitor survey that treats all attendees the same misses the most economically significant group. Local visitors may spend on food and shopping during the event, but tourists generate a much broader economic footprint: accommodation, transport, multiple days of food and retail spending, and in many cases the choice to extend their stay beyond the event itself.
Separating the tourist path in the survey is not just an organisational convenience. It determines which questions get asked. A local visitor does not need to answer questions about accommodation spend or transport mode. A tourist does not need to answer questions about local community impact. Asking everyone every question produces long, confusing forms and lower-quality data.
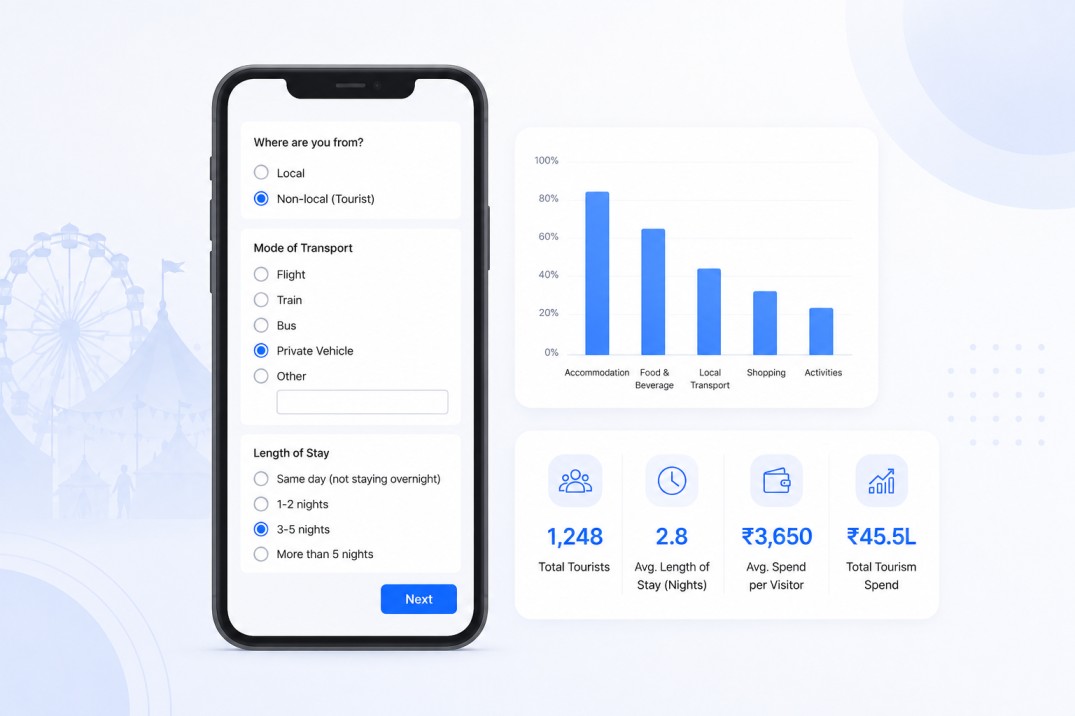
In Clappia, this separation is handled with a Display Condition. A single branching field, Where are you from?, with options for Local and Non-local (Tourist), controls which set of follow-up fields appears. When the enumerator selects Tourist, the full set of tourism-specific fields becomes visible. When they select Local, a different, shorter set appears instead. The enumerator works through one path only, and the form feels appropriately short for each type of visitor.
In Clappia, you build forms by adding blocks, which are individual field types. The tourist branch sits inside a single section of the visitor survey. Add a Dropdown block or Radio Button blockl abelled Where are you from? with two options: Local and Non-local (Tourist). All tourist-specific fields described below should have a Dropdown block set to show only when this field equals Non-local (Tourist).
Add a Dropdown block labelled Visitor Origin. Populate the options with the regions, states, or countries relevant to your event's catchment area. This field tells you where your tourist visitors are coming from, which is essential for understanding the geographic reach of the event and for targeting future marketing. For an event that draws mostly regional visitors, the options might be surrounding states or districts. For an event with international attendance, country names make more sense.
Add a Radio Button block labelled Mode of Transport with options covering the realistic travel modes for your event: flight, train, bus, private vehicle, rental vehicle, and other. Add a Single Line Text block labelled Other transport (please specify) with a Display Condition set to show only when Mode of Transport = Other. This captures edge cases without cluttering the main options list.
Follow the transport question with a Rating or Radio Button labelled How easy was it to reach the event? with options: Easy, Moderate, and Difficult. This ease-of-reach score is a direct input into accessibility planning. If a significant proportion of tourists find the journey difficult, that is an actionable finding for transport infrastructure or event shuttle provision.
Add a Radio Button block labelled Type of Accommodation with options covering the accommodation types available near your event: hotel, homestay, lodge, guesthouse, budget hostel, staying with family or friends, and others. Add the same Other text field pattern with a Display Condition for the other option.
Follow with a Radio Button block labelled Length of Stay with banded options: same day (not staying overnight), one to two nights, three to five nights, more than five nights. Using bands rather than an open number input makes data entry faster and produces cleaner data for analysis. The length of stay figure feeds directly into the average stay calculation, which is one of the core tourism impact KPIs.
Spend capture is the most direct measure of economic impact. Add three separate Dropdown or Radio Button blocks using spend bands rather than open number inputs. Visitors are more comfortable selecting a range than stating an exact figure, and banded data is easier to aggregate and report. The three categories to capture are:
Suggested spend bands should reflect realistic spending at your event. For a regional fair, bands of under 500, 500 to 1000, 1000 to 3000, 3000 to 5000, and over 5000 (in your local currency) cover the realistic range. Adjust the bands based on your location and the type of event. The key is that every tourist gives you a spend figure in all three categories, so you can calculate total per-visitor spend and identify which spend category is largest.
Add a Radio Button block labelled How did you hear about this event? with options covering the channels your event uses: newspaper or print media, word of mouth, radio, social media, television, official website, and other. Add the Other text field with the same Display Condition.
This question is valuable not just for understanding how tourists found out about the event, but for comparing the marketing attribution between local and tourist visitors. If most locals heard through word of mouth but most tourists heard through social media, that tells you which channels are driving out-of-area reach and which are staying local. This comparison requires the awareness question to appear in both the tourist and local branches of the survey, which it should.
Marketing attribution data from a visitor survey is one of the most actionable outputs for an event team. Knowing that social media drove 60 percent of tourist attendance justifies the budget spent on it and points to where to invest for the next edition.
The tourist branch of the survey feeds into the same satisfaction fields as the local branch. Add five Radio Button blocks with options Dissatisfied, Moderate, and Satisfied for:
These fields become much more useful when cross-referenced with the tourist-specific fields. Satisfaction among visitors who travelled a long distance and stayed multiple nights is a different and more important signal than satisfaction among same-day local attendees. A tourist who came from far away and found the amenities poor is unlikely to return or recommend the event. A local who found the amenities moderate may return anyway out of habit or proximity.
Clappia's Analytics feature lets you filter satisfaction scores by visitor origin, length of stay, or mode of transport directly from the submission data. This means you can answer questions like: do visitors who travelled by public transport rate the amenities lower than those who came by private vehicle? Do multi-night visitors give higher overall experience scores than same-day visitors? These cross-tabulations are what turn raw satisfaction data into actionable event improvement priorities.
Once the survey has collected enough responses, the tourist branch fields produce a set of standard tourism impact KPIs. Here is how each one is calculated:
| KPI | How to Calculate It | What It Tells You |
|---|---|---|
| Visitor mix (local vs tourist) | Count of submissions where Where are you from? = Tourist divided by total submissions | The proportion of attendees who are out-of-area visitors; a key headline figure for tourism boards |
| Tourist origin distribution | Count of each option in Visitor Origin, expressed as a percentage of total tourist submissions | Which regions or areas are generating the most tourist visitors; useful for targeted marketing |
| Average length of stay | Weighted average of the Length of Stay band responses from tourist submissions | How long tourists are extending their visit; longer stays mean higher total spend per visitor |
| Ease-of-reach score | Percentage of tourist submissions where How easy was it to reach the event? = Easy | Accessibility perception; a low score indicates a transport or infrastructure problem worth addressing |
| Per-visitor tourist spend | Sum of the midpoints of each spend band across all three categories (accommodation, food, shopping), averaged across tourist submissions | The average total economic contribution per tourist visitor; the headline figure for economic impact estimates |
| Total tourism economic contribution | Per-visitor tourist spend multiplied by estimated total tourist attendance | An estimate of the total economic injection from out-of-area visitors; used in funding applications and impact reports |
| Marketing channel effectiveness | Percentage of tourist submissions attributing their awareness to each channel | Which channels drove out-of-area attendance; feeds directly into marketing budget decisions |
| Tourist satisfaction score | Average satisfaction rating across the five satisfaction fields, filtered to tourist submissions only | How out-of-area visitors rated their experience; a leading indicator of repeat visit intent |
The survey runs on the Clappia mobile app, available on Android and iOS. Enumerators, the team members administering the survey, approach visitors and fill in the form on a phone or tablet. A few practical points make this work smoothly:
In Clappia, user permissions are configured per app. For an on-ground survey, two access levels cover most team structures:
| Role | Access Level | What They Can Do |
|---|---|---|
| Field Enumerator | Submit Only | Fill in and submit survey forms; view their own past submissions |
| Survey Coordinator or Analyst | Full Access | View all submissions; filter by visitor type, origin, or date; build analytics dashboards; export data |
The tourist branch of a visitor survey, covering origin, transport mode, ease of access, accommodation type, length of stay, spend by category, and awareness channel, produces the specific data points that event organisers, tourism boards, and local authorities need to quantify the economic value of a festival or fair. Without structured on-ground data collection, this information simply does not exist in a reliable form.
Building this survey in Clappia takes the guesswork out of data collection. The Display Condition that separates the tourist and local paths ensures enumerators collect the right information from the right visitors without confusion. The spend bands produce consistent, aggregable figures. The satisfaction fields, cross-referenced with tourist characteristics in Clappia's Analytics, show which aspects of the experience matter most to the visitors who travelled furthest to attend.
The result is a dataset that supports funding applications, marketing decisions, infrastructure planning, and event improvement priorities, all from a single mobile form administered during the event. To build the survey, create a new app in Clappia and follow the field structure described above.
L374, 1st Floor, 5th Main Rd, Sector 6, HSR Layout, Bengaluru, Karnataka 560102, India
3500 S DuPont Hwy, Dover,
Kent 19901, Delaware, USA


.svg)




3500 S DuPont Hwy, Dover,
Kent 19901, Delaware, USA
L374, 1st Floor, 5th Main Rd, Sector 6, HSR Layout, Bengaluru, Karnataka 560102, India