
Traditional reactive inventory management—addressing stockouts after they occur—costs manufacturing operations millions in emergency freight, expedited orders, production downtime, and lost sales. Proactive inventory control shifts from reactive firefighting to predictive prevention.
Build proactive inventory control systems with Clappia's AI-powered no-code platform. Create intelligent apps with predictive analytics, real-time monitoring dashboards, automated threshold alerts, demand forecasting, trend analysis, and production planning integration—preventing stockouts before they happen.
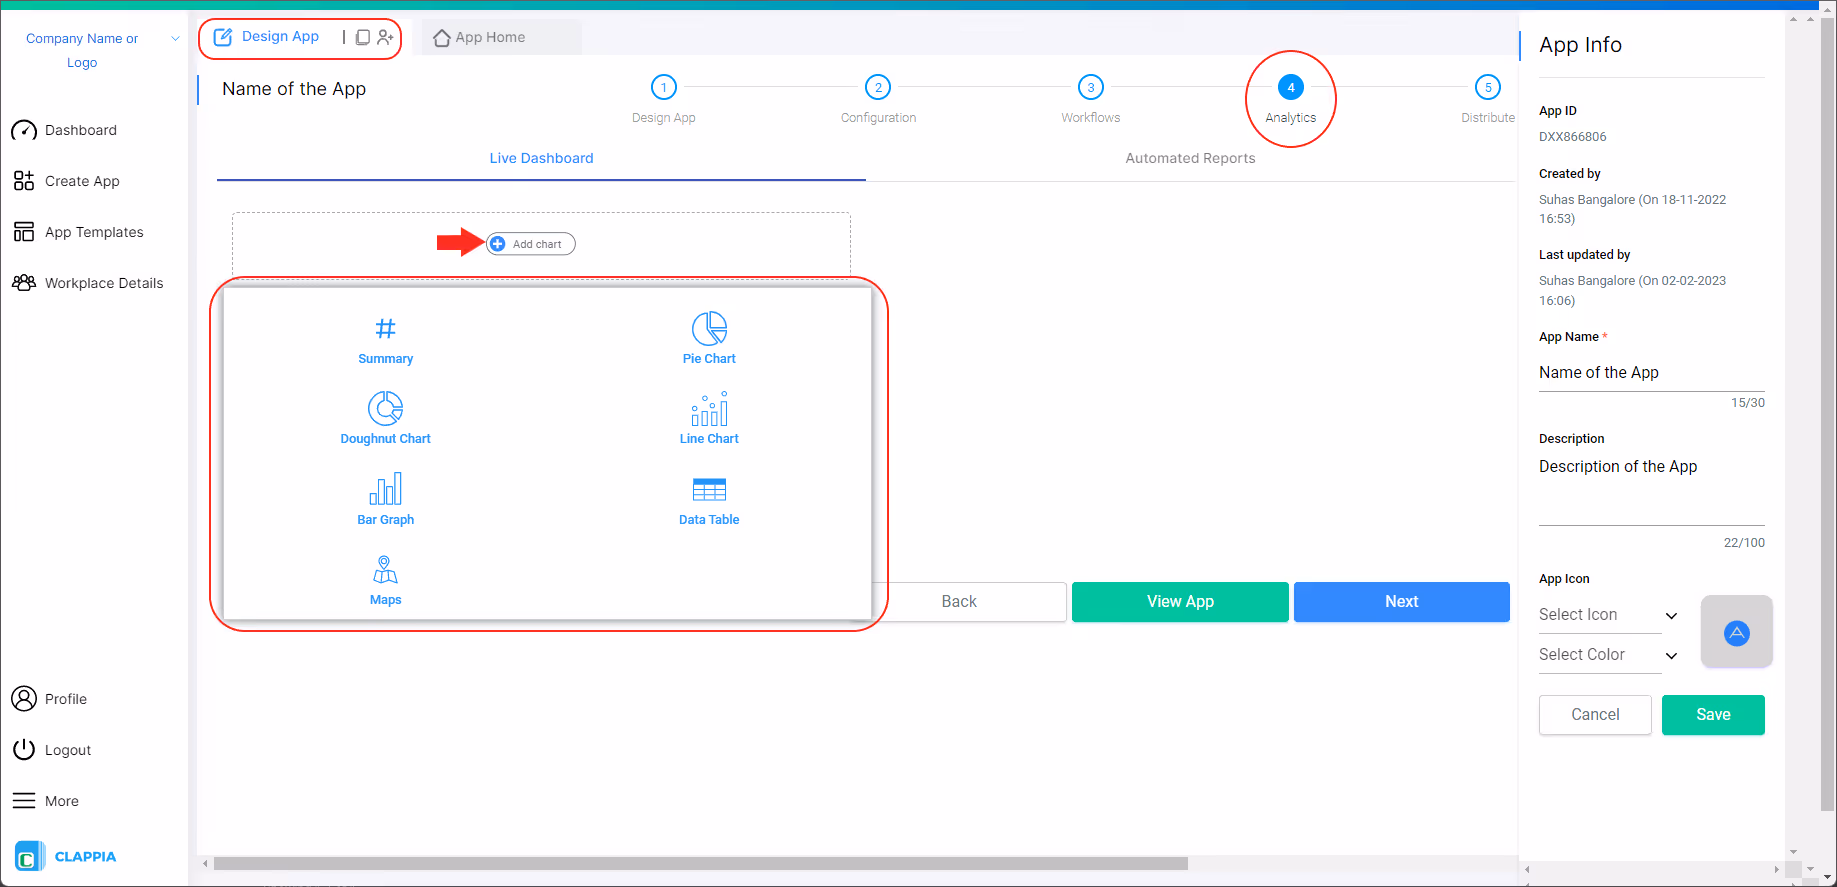
Real-time analytics dashboards provide instant visibility into inventory health. Live dashboards update automatically as transactions occur. Bar graphs compare stock levels against reorder points and maximums. Line charts visualize consumption trends, seasonal variations, demand fluctuations. Pie charts display inventory value distribution across categories.
Data tables list materials requiring attention: items approaching reorder points, zero stock, slow-moving inventory, excessive stock. Filter, sort, search across thousands of SKUs identifying exceptions instantly.
Manufacturing Benefit: Production managers see real-time material availability. Purchasing teams identify materials requiring attention without manual analysis. Executive dashboards provide strategic oversight for financial planning.

AI blocks analyze historical data, production schedules, seasonal patterns, market trends to forecast future material requirements using OpenAI, Claude, or Gemini. Predictive algorithms identify demand patterns calculating optimal inventory levels proactively.
Formula blocks calculate predictive reorder points dynamically: (Forecasted Daily Consumption × Lead Time) + Safety Stock + Demand Variability Buffer. Formulas adjust safety stock automatically based on consumption volatility, lead time variability, production criticality.
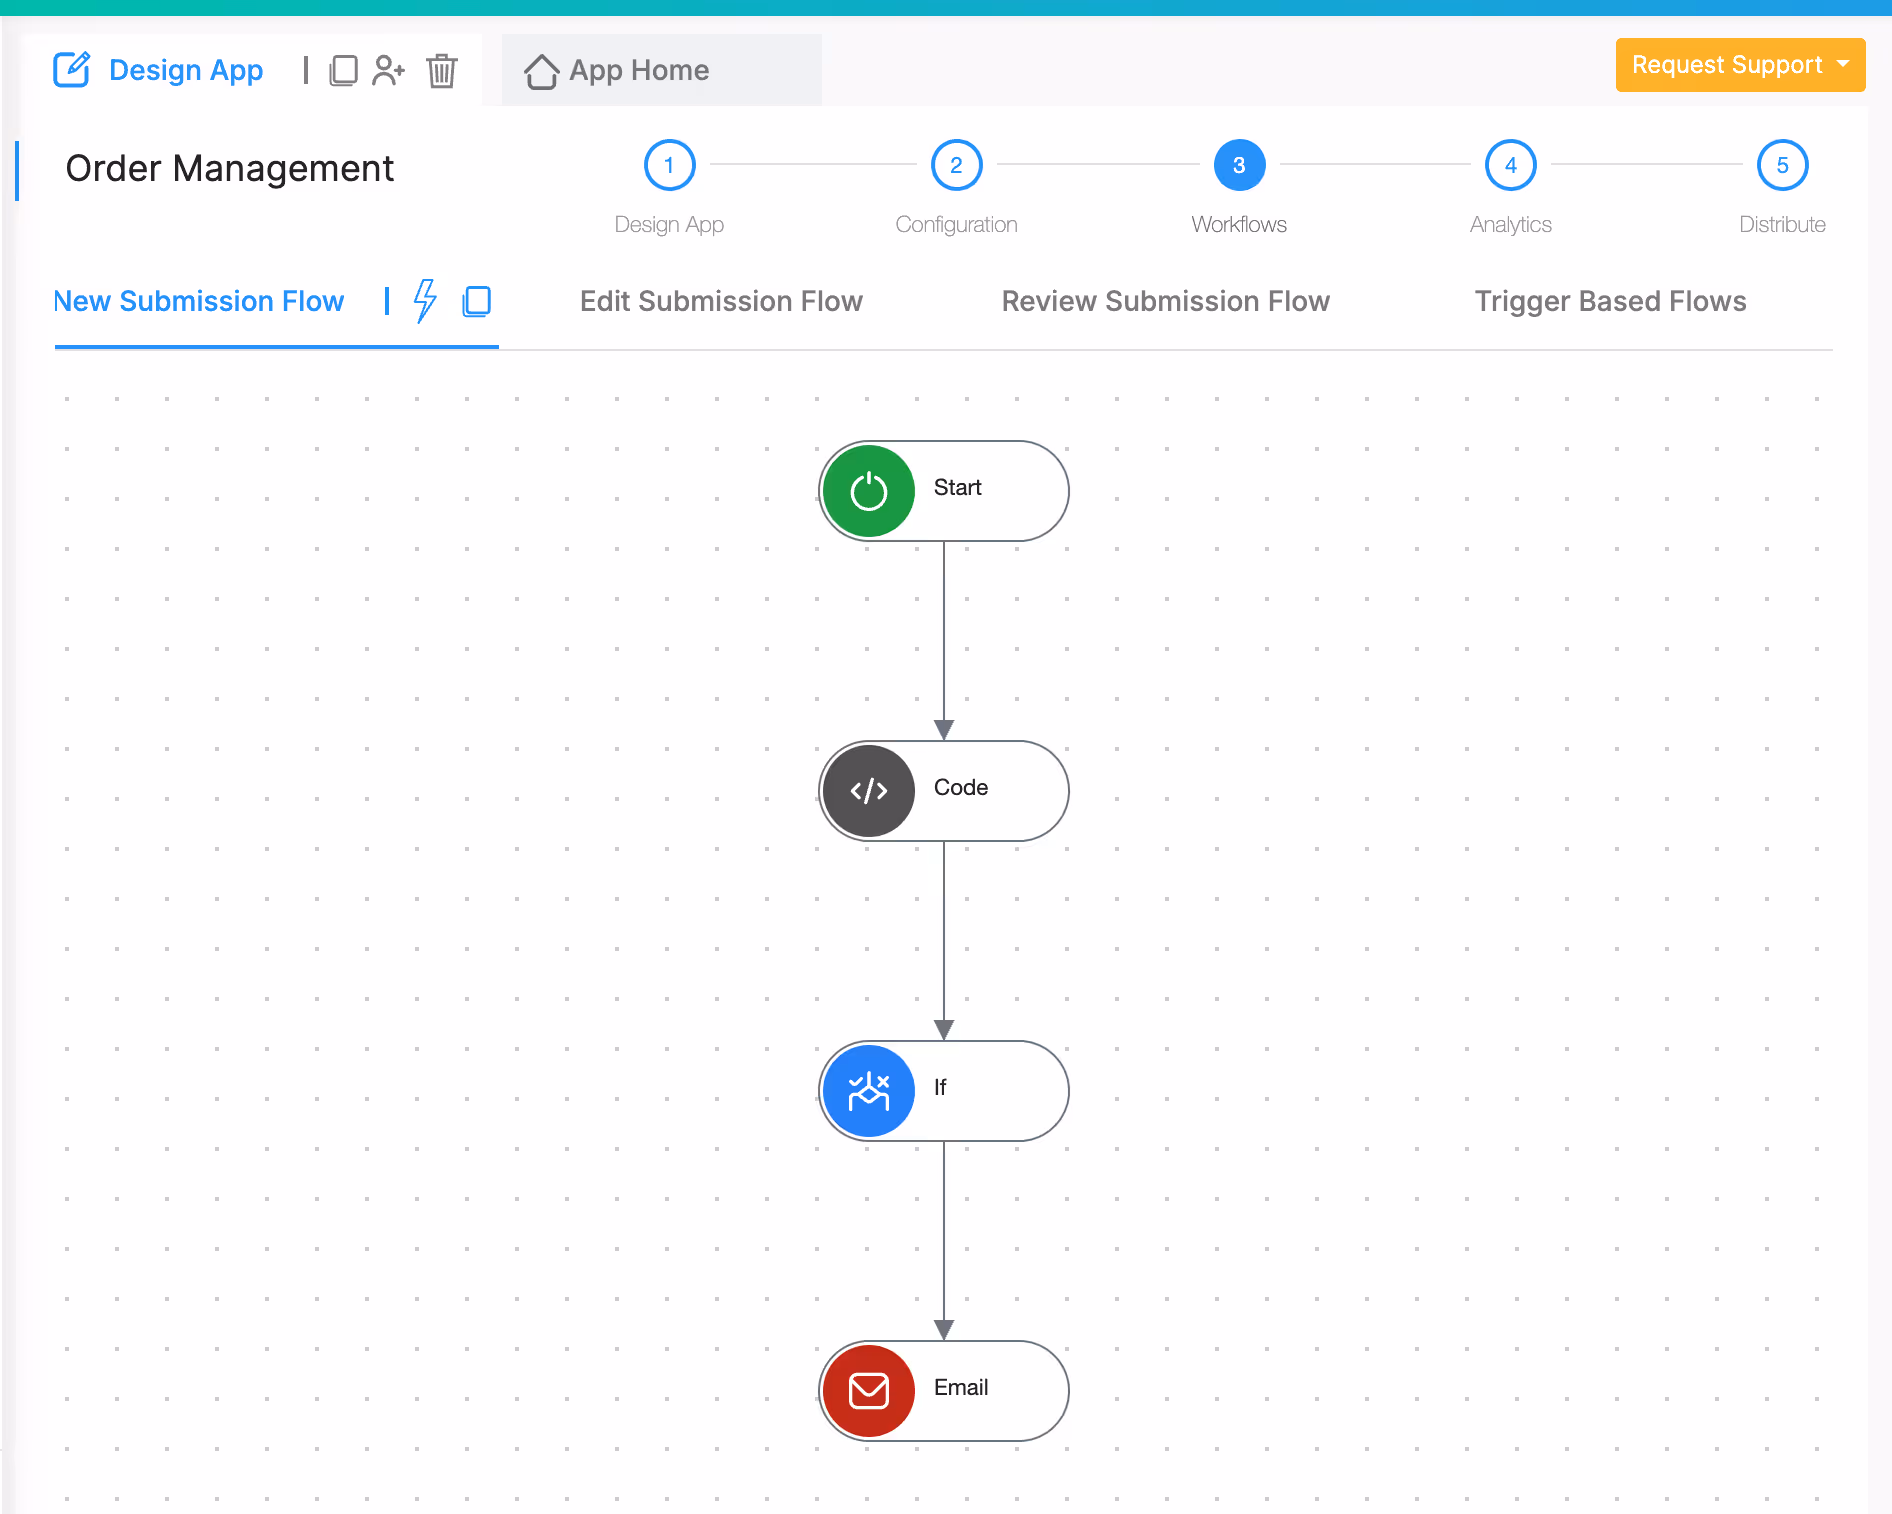
JavaScript code blocks implement advanced forecasting: moving averages, exponential smoothing, seasonal decomposition, regression analysis. Custom algorithms match unique manufacturing demand characteristics.
Manufacturing Impact: Anticipate material needs weeks in advance based on production forecasts. Adjust inventory proactively for seasonal demand changes, promotional campaigns, product mix shifts. Prevent stockouts through prediction instead of reaction.
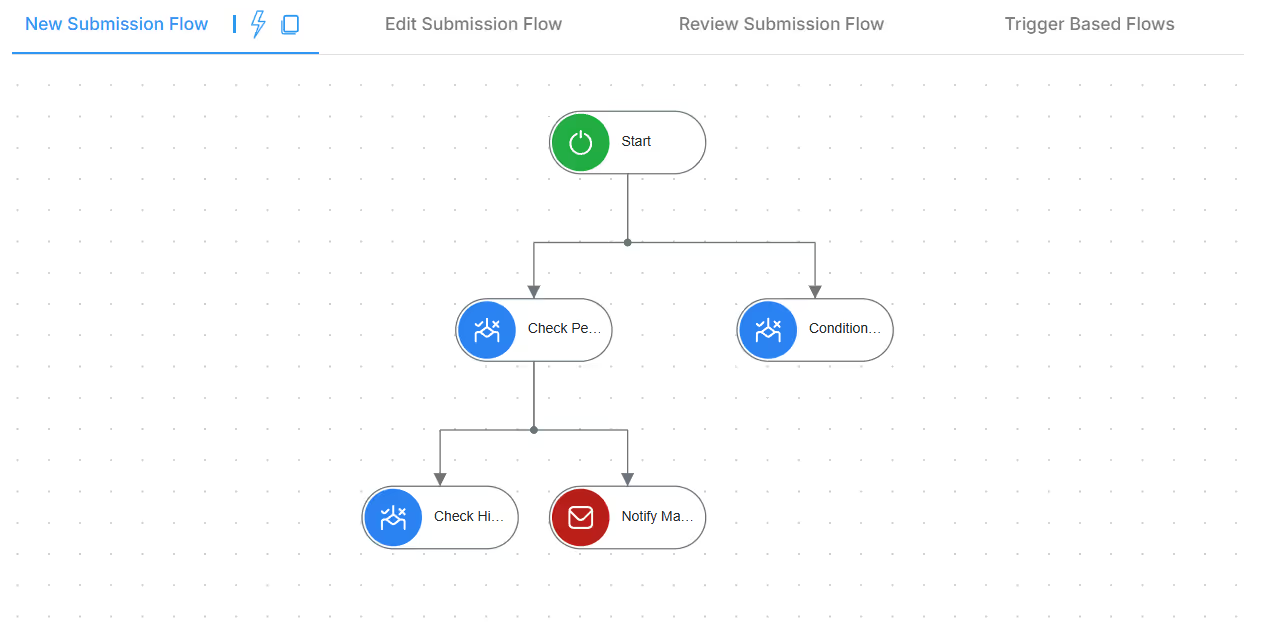
Conditional workflows monitor multiple thresholds: reorder points, minimum stock, maximum stock, excess inventory, slow-moving periods. Automated alerts trigger instantly when inventory crosses thresholds.
Intelligent escalation routes alerts by severity: routine reorder alerts via email, critical shortages via mobile push, zero stock via SMS and WhatsApp to suppliers.
Multi-threshold monitoring tracks inventory health: approaching reorder points (yellow), below minimum (orange), zero stock (red), exceeding maximum (blue), not moving 90+ days (purple).
Manufacturing Benefit: Purchasing receives advance notice before stockouts—time for competitive sourcing instead of emergency orders. Production alerted to potential material shortages affecting schedules. Executives notified of inventory exceptions.

Database workflows pull production schedules from ERP systems (SAP, Oracle, Dynamics) and MES platforms. Query planned work orders, extract BOMs, calculate gross requirements, subtract available inventory, generate net needs—automated MRP aligning inventory with production.
REST API integration synchronizes bidirectionally: push inventory availability into production planning, pull production forecasts into inventory planning. Production consumption feedback refines predictions: compare actual vs. planned usage, adjust future forecasts based on real patterns.
Manufacturing Impact: Materials ordered proactively based on production schedules. Production planning uses current inventory preventing infeasible schedules. Integrated planning optimizes both efficiency and inventory investment.
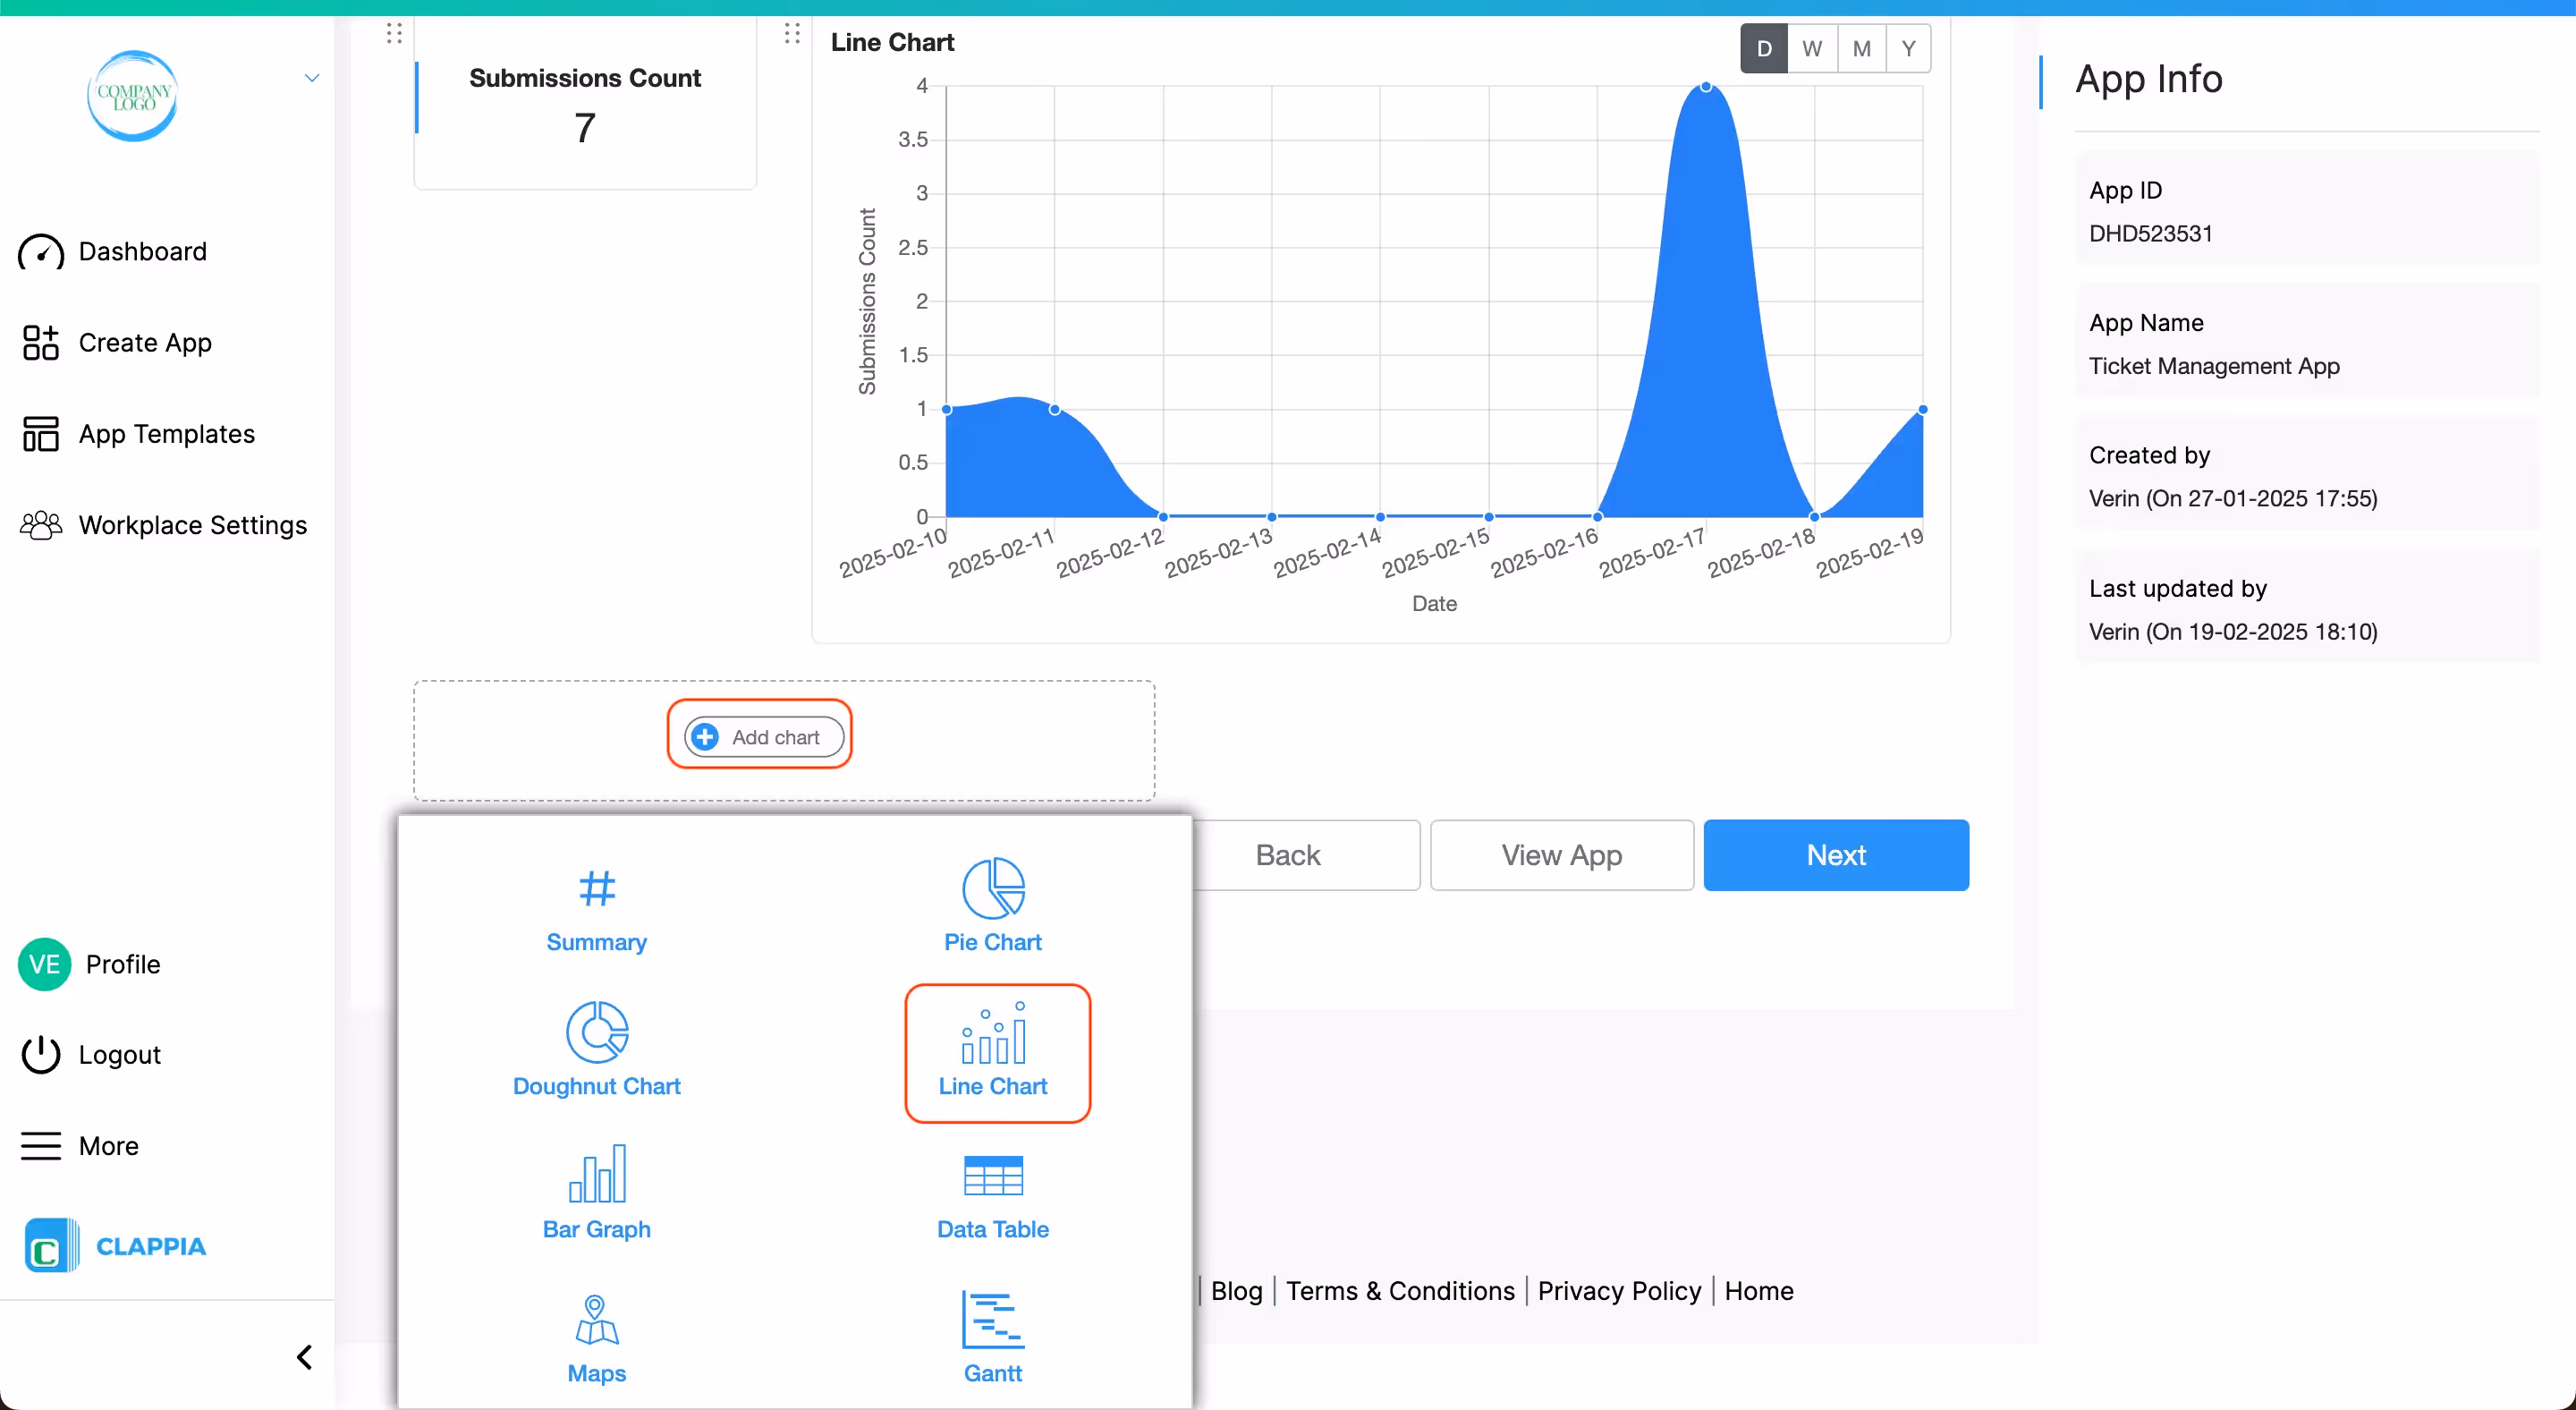
Line chart analytics visualize consumption trends identifying: increasing demand requiring higher reorder points, decreasing demand allowing lower safety stock, seasonal patterns requiring proactive adjustments, sudden spikes indicating quality issues or production changes.
Compare multiple data series: actual consumption vs. forecasted demand, current levels vs. optimal levels, this year vs. last year, different product lines. Multi-series visualization reveals correlations and anomalies impossible to spot in spreadsheets.
Manufacturing Benefit: Visual pattern recognition reveals trends invisible in numeric tables. Early identification enables proactive adjustments preventing future stockouts or excess inventory.
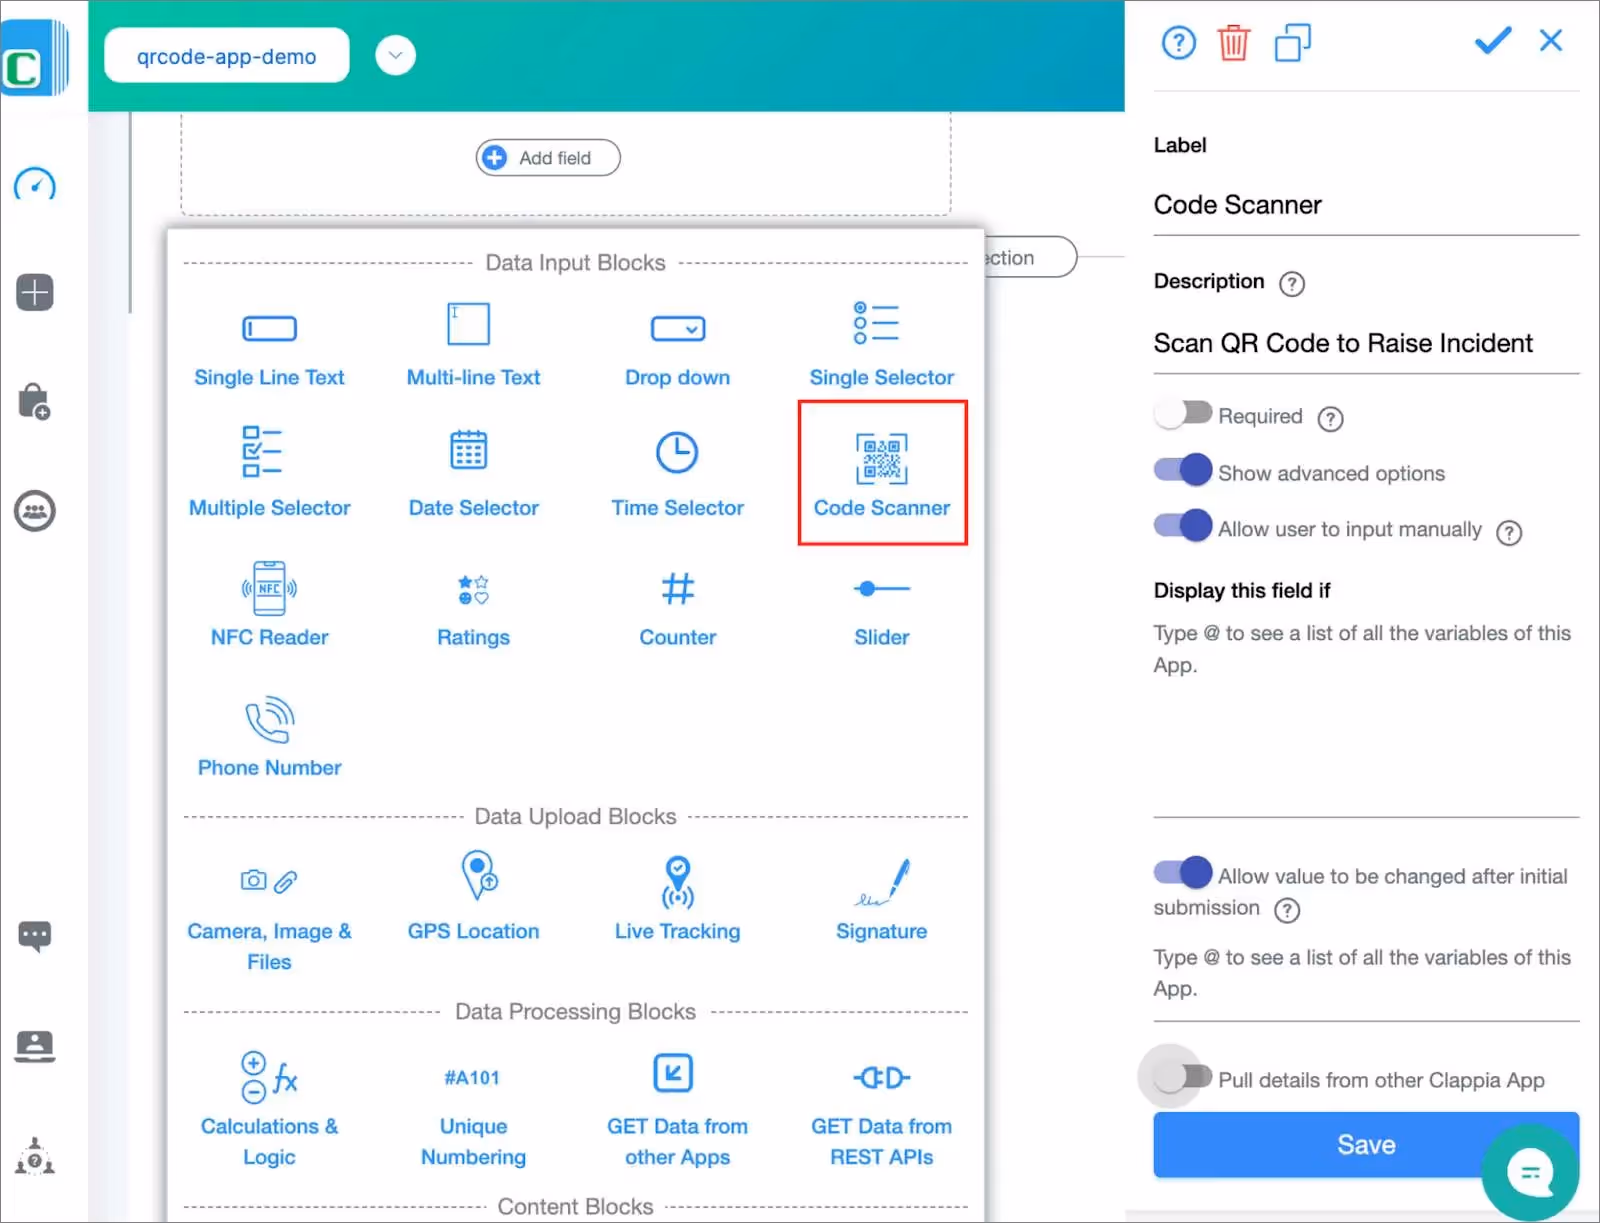
Mobile apps with barcode scanning enable continuous cycle counting maintaining accuracy. Assign counting tasks, scan locations and materials, enter counts, calculate variances, trigger recounts. Offline capability allows counting in areas without connectivity—syncs automatically when reconnected.
ABC classification prioritizes high-value items for frequent counts. Variance analysis identifies root causes. Automated adjustments keep system inventory aligned with physical reality.
Manufacturing Benefit: Accurate data ensures predictive analytics based on reality. Continuous counting maintains year-round accuracy without disruptive physical inventories.
Track supplier performance automatically: on-time delivery rates, average lead times, quality acceptance rates, pricing competitiveness. Supplier scorecards quantify reliability, quality, cost over time. Automated reports email quarterly performance reviews.
Predictive inventory incorporates supplier reliability: unreliable suppliers maintain higher safety stock, reliable suppliers enable leaner inventory through confident lead time predictions.
Manufacturing Impact: Data-driven supplier selection optimizes delivery, quality, cost. Unreliable suppliers identified proactively before causing production disruptions.

Tags block classifies materials: A-items (high-value), B-items (moderate), C-items (low-value). Different strategies apply automatically: A-items receive sophisticated control (frequent counts, tight monitoring, forecasting, executive visibility), B-items use standard systems, C-items operate with simple two-bin replenishment.
Dynamic reclassification adjusts as material importance changes. Automated reclassification ensures control intensity matches current criticality.
Manufacturing Benefit: Focus proactive control on high-impact materials. Avoid over-managing low-value items consuming disproportionate resources. Optimize sophistication matching significance.

Inventory management apps track stock across multiple warehouses, facilities, distribution centers. Consolidated visibility shows total inventory plus location-specific quantities. Transfer workflows balance stock optimally.
Location-specific reorder points account for local consumption, supplier proximity, transportation lead times. Automated transfer recommendations identify surplus at one location while another approaches stockout—suggesting internal transfers before external purchases.
Manufacturing Benefit: Enterprise-wide visibility prevents simultaneous stockouts and excess at different locations. Proactive transfers optimize internal inventory before purchasing additional stock.
Automated workflows generate purchase orders when inventory crosses reorder points. Unique ID generation creates sequential PO numbers. Dynamic PDF generation creates formatted orders. QR code and barcode generation embed tracking codes.
Approval workflows route through authorization chains. Supplier integration sends orders automatically via email, WhatsApp, or REST API.
Manufacturing Benefit: Materials order automatically—zero delays. Proactive processing ensures materials arrive before stock depletion.
Google Sheets integration enables collaborative planning. Maintain supplier info, material specs, reorder parameters in sheets. Bidirectional sync: automated systems pull current data, inventory transactions update sheets. Bulk upload imports initial data from Excel/CSV.
Manufacturing Benefit: Maintain master data in accessible Google Sheets. Teams collaborate while automated systems access current data.
Access complete transaction history: materials received, production consumption, shipments, adjustments, cycle counts. Historical data supports trend identification, audit trails, performance measurement. Automated reports email scheduled summaries. Export to Excel, CSV, PDF for flexible analysis.
Manufacturing Benefit: Complete audit trails for compliance. Historical analysis identifies improvement opportunities: materials with frequent stockouts, consistent excess, seasonal patterns.

Conditional sections show different fields based on material characteristics: hazardous materials display safety documentation, imported materials add customs fields, lot-controlled materials capture lot numbers and expiration dates.
Validation rules enforce data quality: require lot numbers for food/pharmaceutical materials, validate shelf life for perishables, ensure serial numbers for warranty-tracked equipment.
Manufacturing Benefit: System adapts to unique requirements. Accommodate hazardous materials, lot tracking, serial tracking, consignment inventory within single flexible platform.
Proactive inventory control shifts from reactive management (addressing stockouts after occurrence) to predictive prevention using real-time monitoring, automated alerts, demand forecasting, trend analysis. Instead of ordering when shortages happen, proactive systems predict future requirements based on production schedules, historical patterns, demand forecasts—ordering before depletion. Clappia enables proactive control through real-time analytics, predictive formulas, automated threshold alerts, production integration, preventing stockouts while optimizing inventory investment.
Predictive analytics analyzes historical consumption, production schedules, seasonal patterns, market trends to forecast future material requirements. AI blocks and advanced formulas calculate optimal inventory levels proactively—adjusting reorder points dynamically based on demand forecasts, consumption variability, lead time changes. Systems order materials weeks in advance based on production forecasts instead of reactive historical consumption. Early trend identification enables proactive adjustments: increase orders when demand trending upward, reduce when declining, adjust seasonally—preventing both stockouts and excess inventory through prediction.
Yes, database workflows and REST API integration synchronize with ERP systems (SAP, Oracle, Dynamics) and MES platforms bidirectionally. Pull production schedules to calculate future material requirements: query planned work orders, extract BOMs, calculate gross requirements, subtract available inventory. Push inventory availability into production planning—schedulers see current material availability. Integration ensures materials ordered aligned with production while production scheduled considering material reality—optimizing both manufacturing efficiency and inventory investment.
Real-time analytics dashboards provide instant visibility. Bar graphs compare stock against thresholds, line charts visualize trends, pie charts show value distribution, data tables list materials requiring attention. Live updates eliminate delayed reporting—decisions based on current reality. Visual pattern recognition reveals trends invisible in numeric tables: increasing demand requiring proactive adjustments, decreasing demand allowing reductions, seasonal patterns enabling strategy changes.
Conditional workflows monitor multiple thresholds continuously. Automated alerts trigger instantly via email, mobile push, SMS, WhatsApp. Intelligent escalation routes by severity: routine alerts to purchasing, critical shortages to production managers, zero stock to plant directors. Multi-threshold monitoring: yellow for approaching reorder points, orange for below minimum, red for stockouts, blue for overstock. Proactive alerts provide advance notice enabling competitive sourcing instead of emergency orders.
ABC analysis using tags classifies materials by value: A-items (high-value), B-items (moderate), C-items (low-value). Different strategies apply automatically: A-items receive sophisticated management (frequent counts, tight monitoring, forecasting, executive visibility), B-items use standard systems, C-items operate with simple replenishment. Dynamic reclassification adjusts as importance changes. ABC prioritization focuses proactive control on high-impact materials generating maximum return—avoiding over-management of low-value items. Optimize control sophistication matching material significance.
Yes, inventory management apps track stock across multiple warehouses, facilities, distribution centers. Consolidated visibility shows enterprise-wide inventory plus location-specific quantities. Location-specific reorder points account for local consumption, supplier proximity, transportation lead times. Automated transfer recommendations identify surplus at one location while another approaches stockout—suggesting internal transfers before external purchases. Multi-location analytics optimize placement: consolidate slow-moving inventory, redistribute fast-moving stock, balance safety stock. Enterprise-wide visibility prevents simultaneous stockouts and excess at different locations through proactive redistribution.
Shift from reactive firefighting to predictive prevention. Create intelligent inventory control with real-time monitoring, automated alerts, demand forecasting, production planning integration, and visual analytics—preventing stockouts while optimizing inventory investment.


L374, 1st Floor, 5th Main Rd, Sector 6, HSR Layout, Bengaluru, Karnataka 560102, India
3500 S DuPont Hwy, Dover,
Kent 19901, Delaware, USA


3500 S DuPont Hwy, Dover,
Kent 19901, Delaware, USA
L374, 1st Floor, 5th Main Rd, Sector 6, HSR Layout, Bengaluru, Karnataka 560102, India
.svg)